In late 2023 Microsoft announced a new feature “Analyze” to all list pages. This allows us to analyze data in a pivot table fashion with the fields on the list page without exporting data into Excel. To try this functionality, you must be on Business Central version 23 or higher. Follow the steps mentioned below
- Open any list page
– For example, you can always start with a ledger entry page as it has a lot of information available. for this example let’s try the Customer Ledger Entries page. - In the action bar at the top, toggle the Analyze toggle switch and then the Analysis 1 view will open
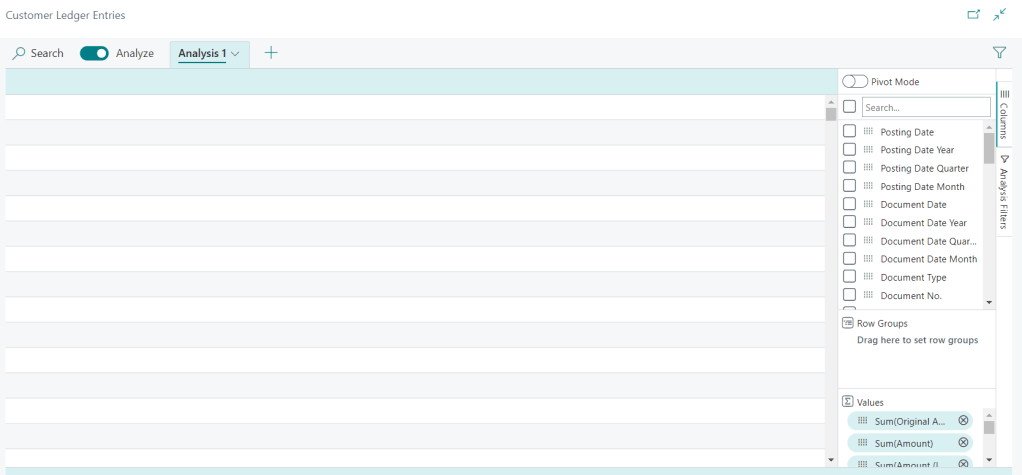
The main value here is using the Pivot Mode. Once you enable the Pivot Mode you can create a report on the live data that is in Business Central without any lag. To try this, let’s try creating a pivot that shows us the sum total of the remaining amount per customer.
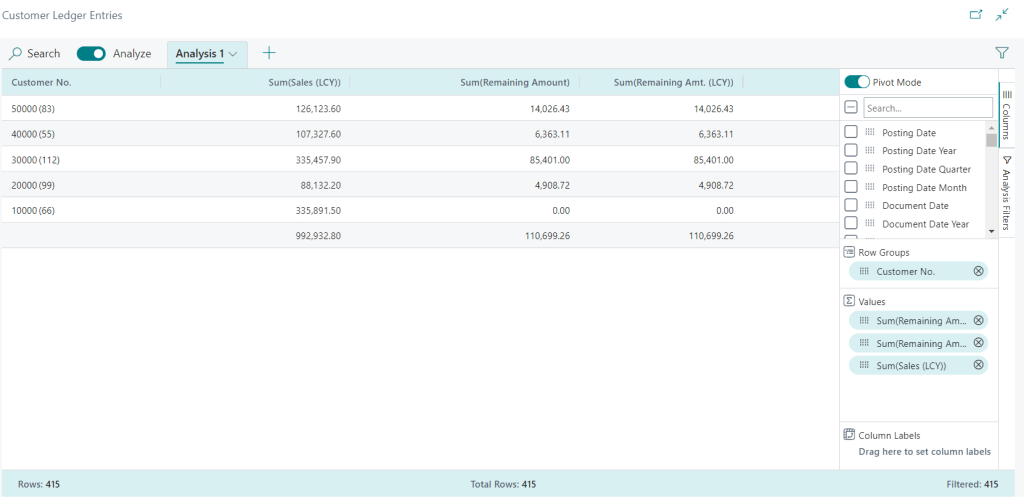
The Pivot is created by dragging and dropping the field Customer No. from the field list into the Row Groups and adding the other fields Remaining Amount, Remaining Amount. (LCY) and Sales (LCY) field in the Values section.
Good luck and happy analyzing the data. 🙂

Leave a comment